Here are two maps I made on the occasion of the EuroCarto, using open data, some geoprocessing tools and the powerful symbolization tools of ArcGIS Pro.
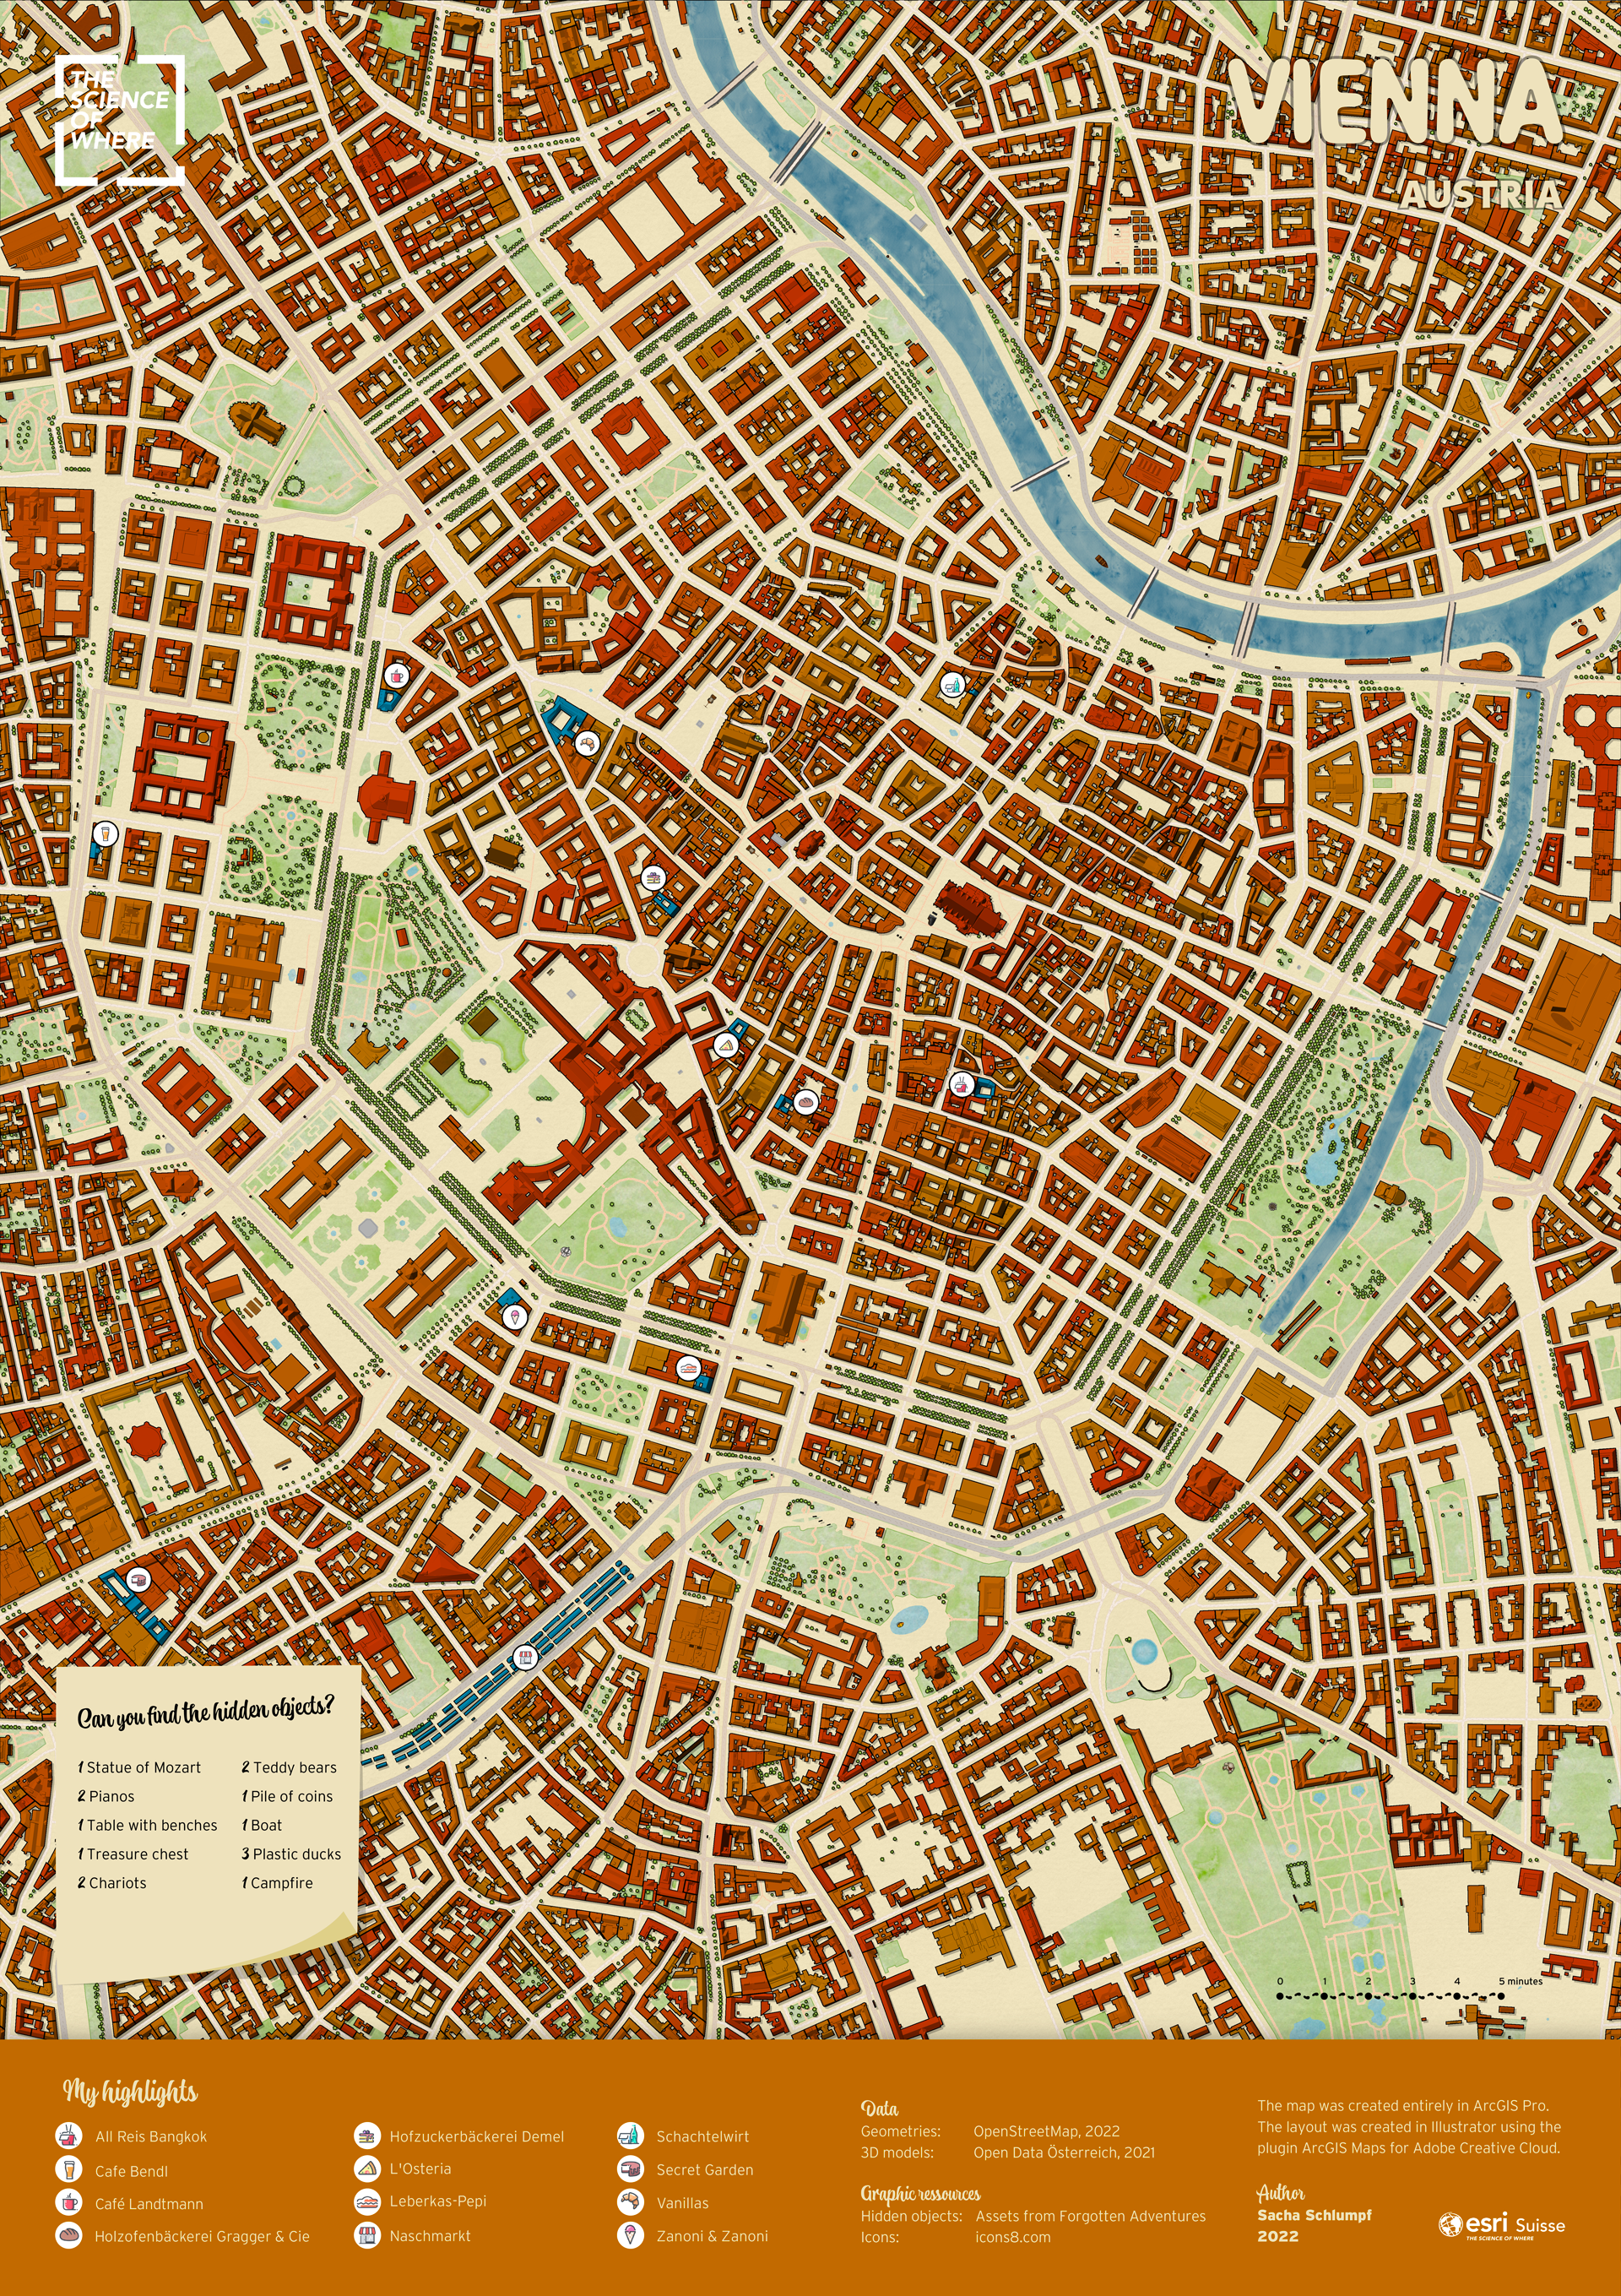
As you can see, the buildings have more depth than simple polygons. I used the 3D models of the buildings found on Open Data Austria which I transformed into a DEM to generate a shaded relief. To give them colour, I overlapped the polygons of the same buildings, whose colours are chosen randomly on a defined gradient.
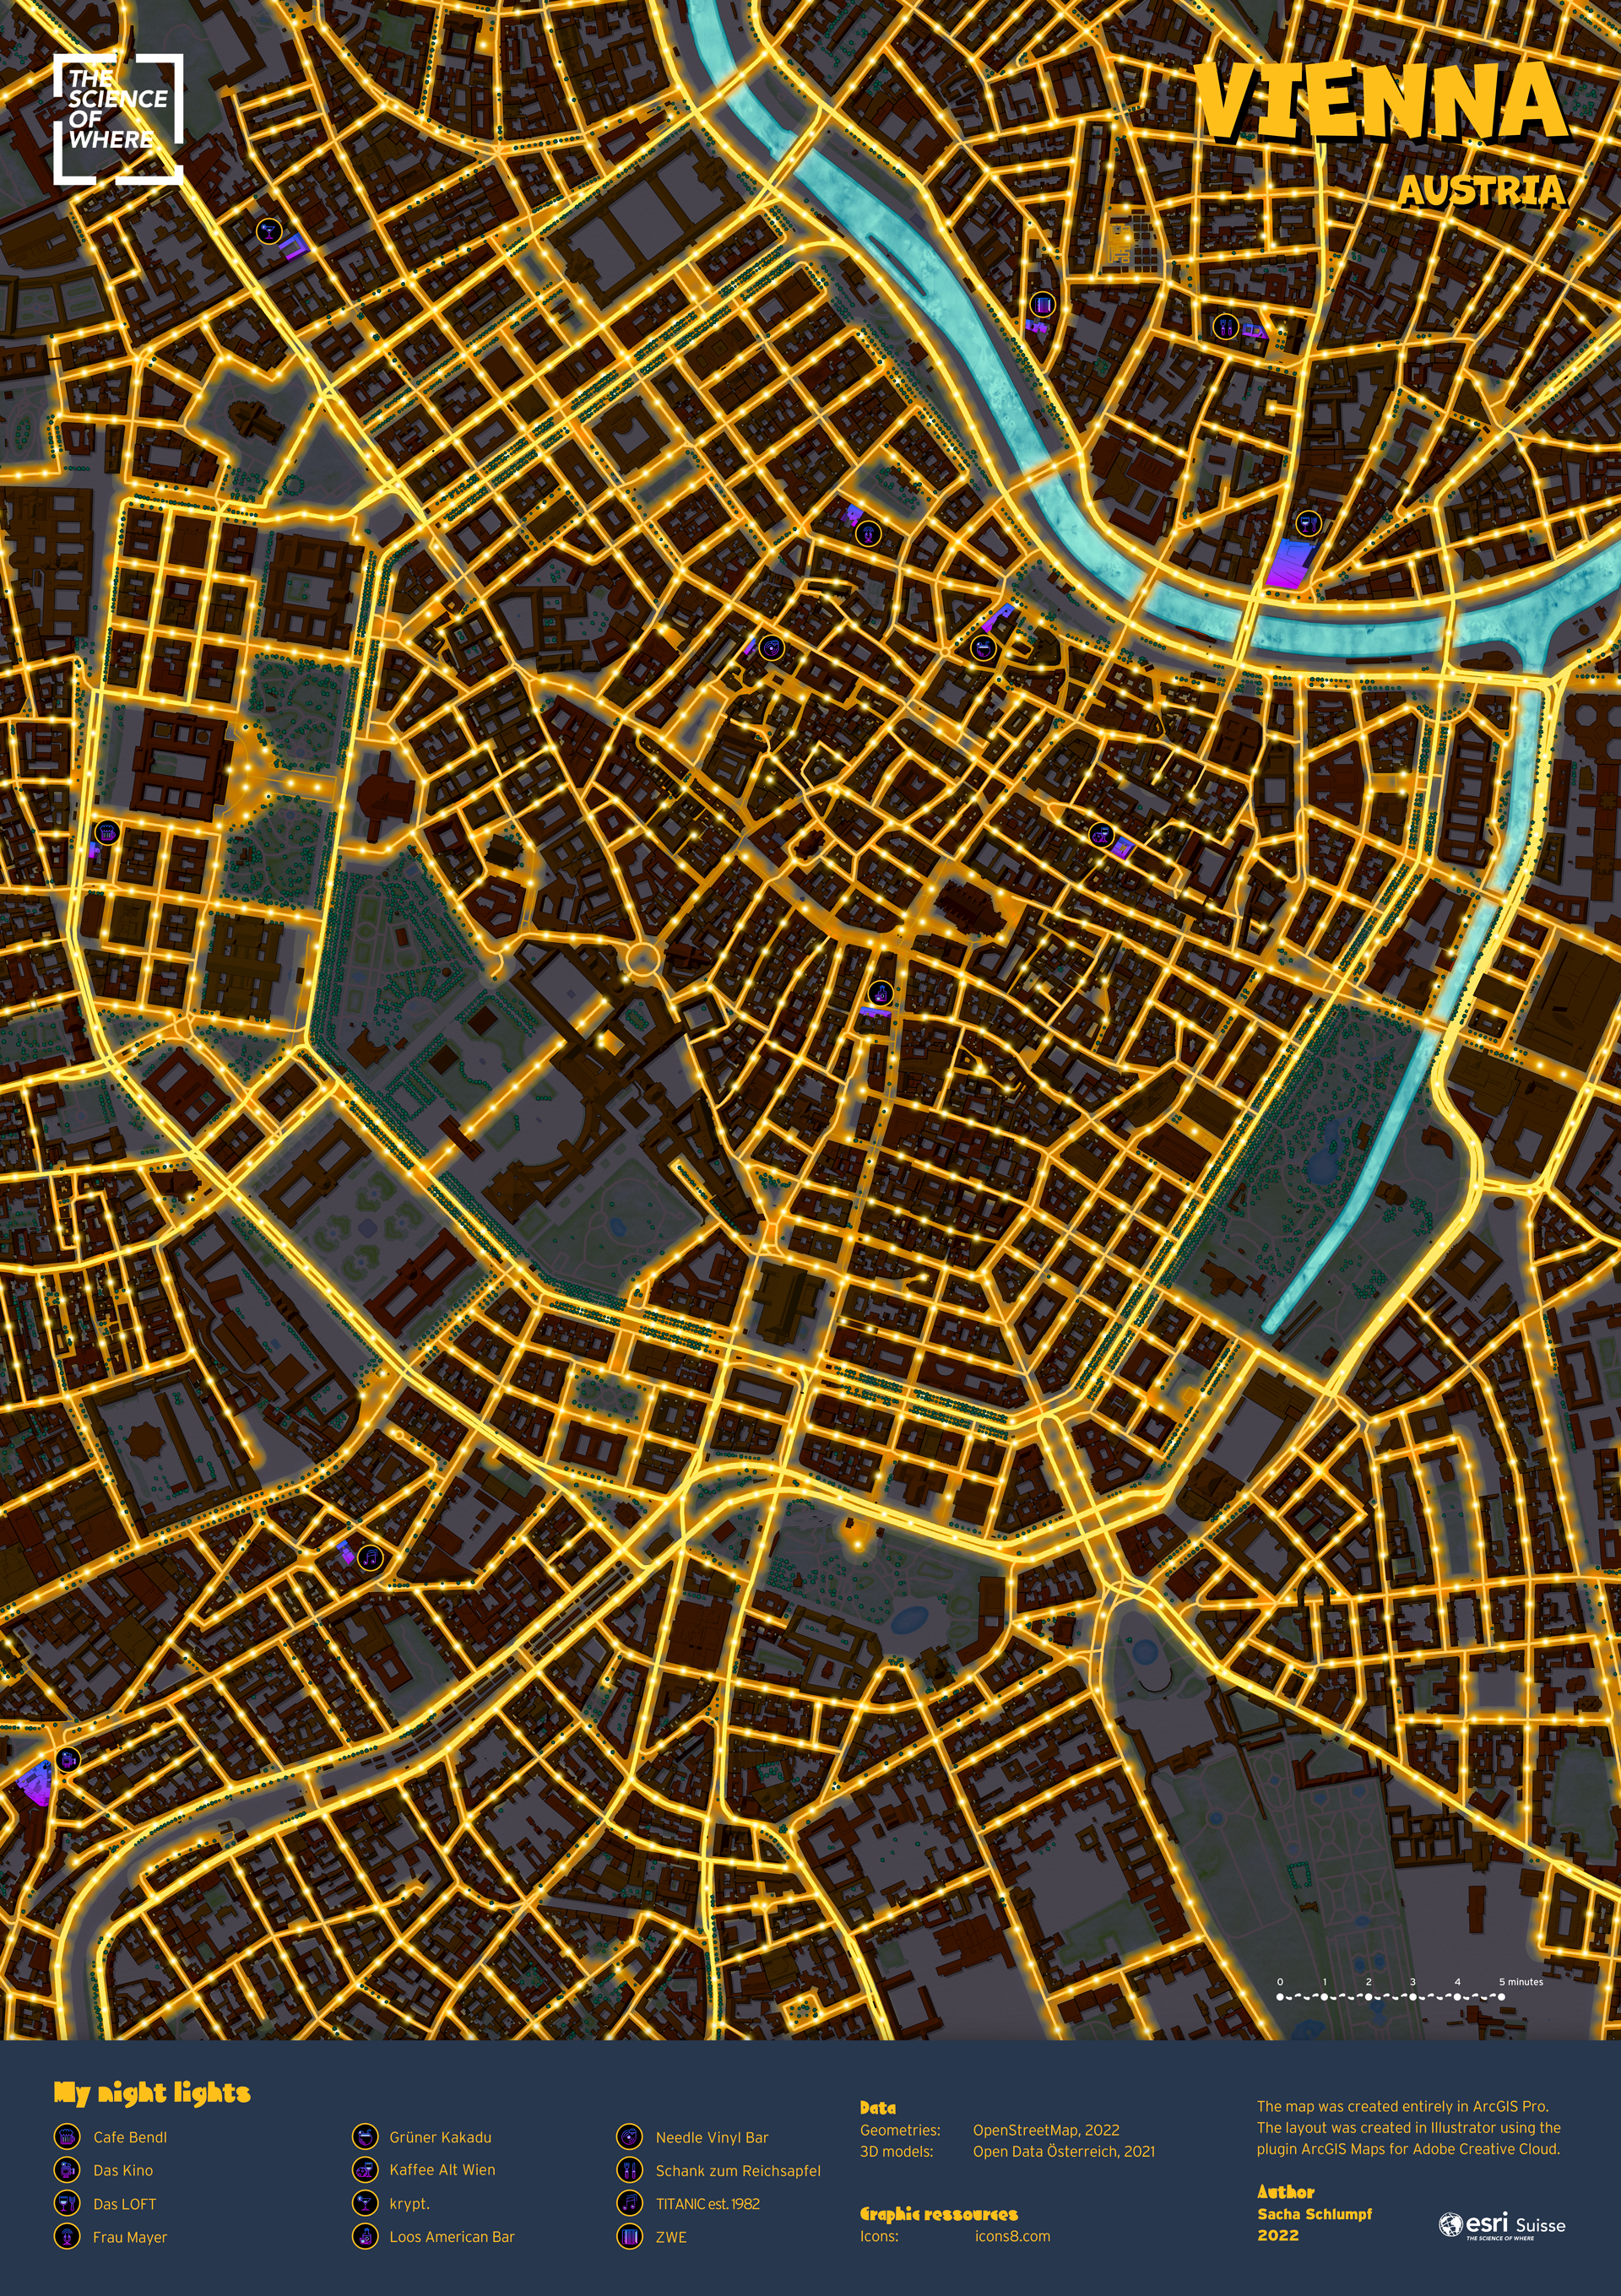
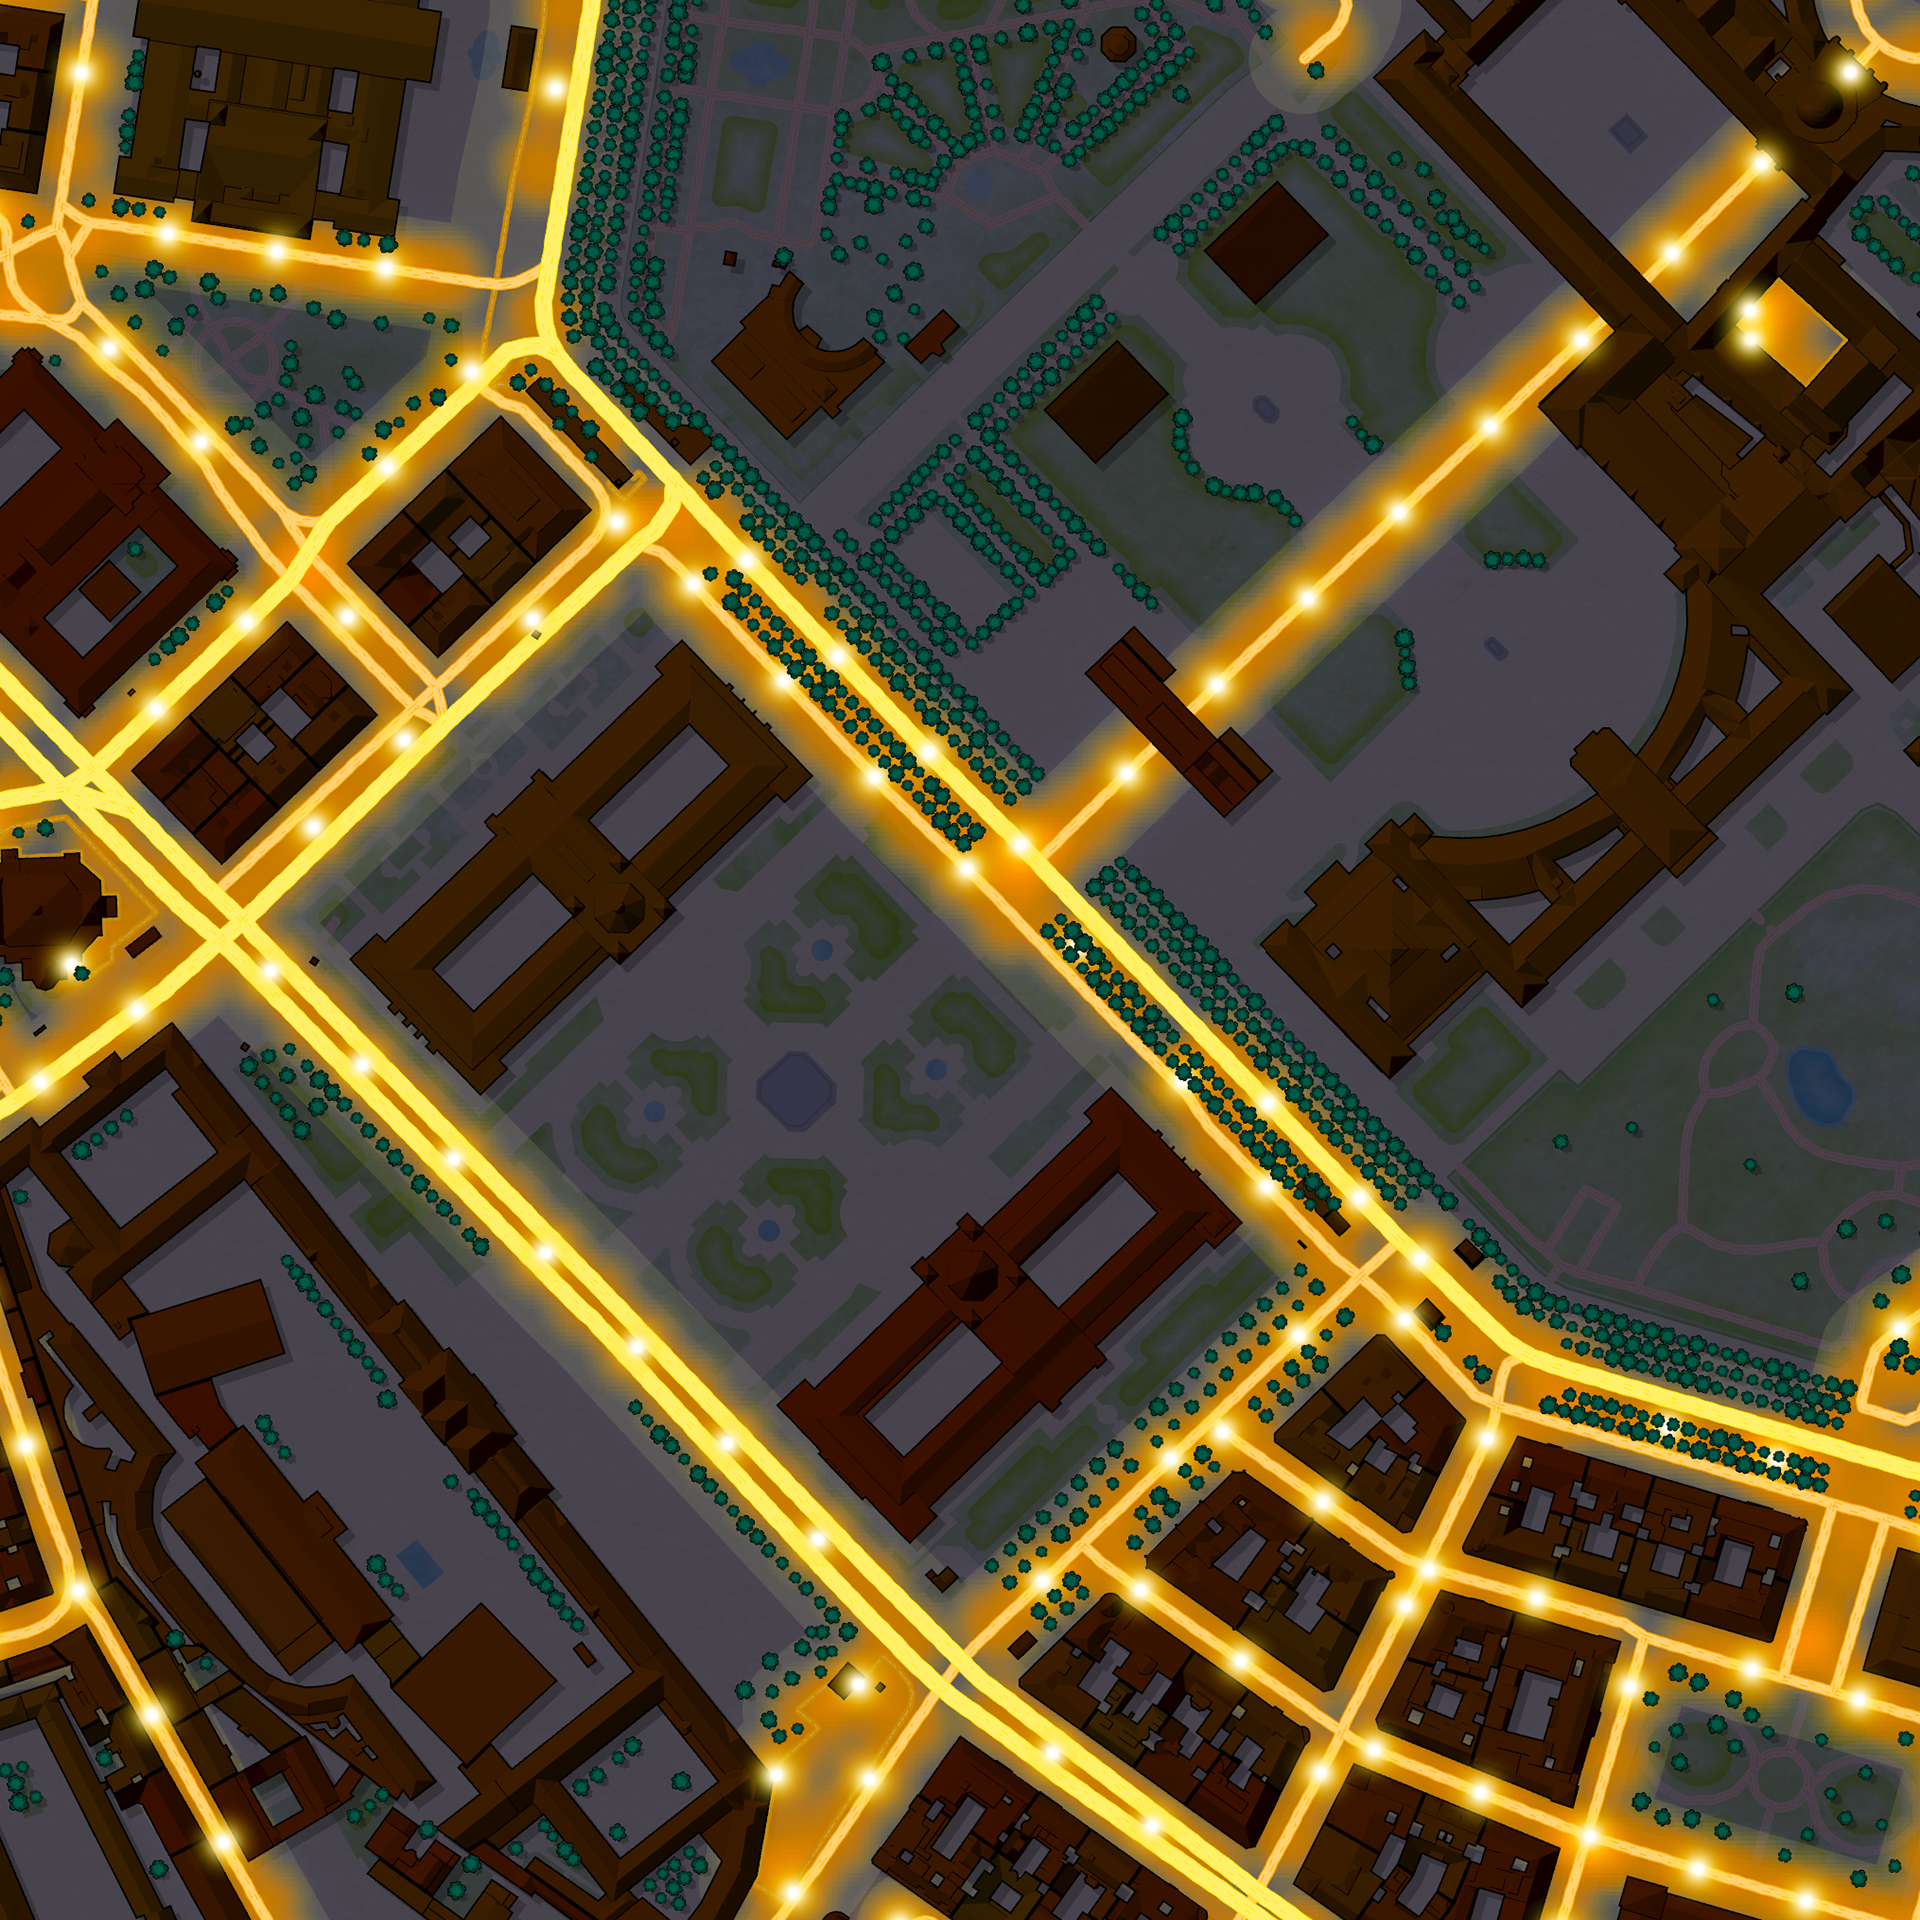
To map Vienna at night, I first needed streetlights. To imitate them, I generated points along chosen street types and simplified this layer of points. The overlapping of four layers create then the glowing effect:
1. The streetlights themselves
2. The streets, in yellowish colors
3. An orange heat map, created using the streetlights point layer
4. A buffer around the streets
As you can see, the buildings have more depth than simple polygons. I used the 3D models of the buildings found on Open Data Austria which I transformed into a DEM to generate a shaded relief. To give them colour, I overlapped the polygons of the same buildings, whose colours are chosen randomly on a defined gradient.
To map Vienna at night, I first needed streetlights. To imitate them, I generated points along chosen street types and simplified this layer of points. The overlapping of four layers create then the glowing effect:
1. The streetlights themselves
2. The streets, in yellowish colors
3. An orange heat map, created using the streetlights point layer
4. A buffer around the streets
Tools: ArcGIS Pro | Adobe Illustrator
Format: A1 (each)
Context: Internship at Esri Zurich. Maps exhibited at the European Cartographic Conference (EuroCarto) in Vienna in 2022
Context: Internship at Esri Zurich. Maps exhibited at the European Cartographic Conference (EuroCarto) in Vienna in 2022